In this post, we will quickly demonstrate how to enable Slow Query Log on Google Cloud SQL for MySQL.
- Open Cloud SQL Dashboard
- Click Edit on your Database
- For Cloud SQL MySQL instances, add these 3 flags (a.k.a. configuration parameters) to your instance:
- log_output - file / table / none
We recommend to choose file, which will help you to quickly visualize and analyze your slow query using EverSQL - slow_query_log - On/Off
- long_query_time - number, in seconds.
For example, 1 means that the log will capture all queries that are longer than 1 second. 0 means capturing all queries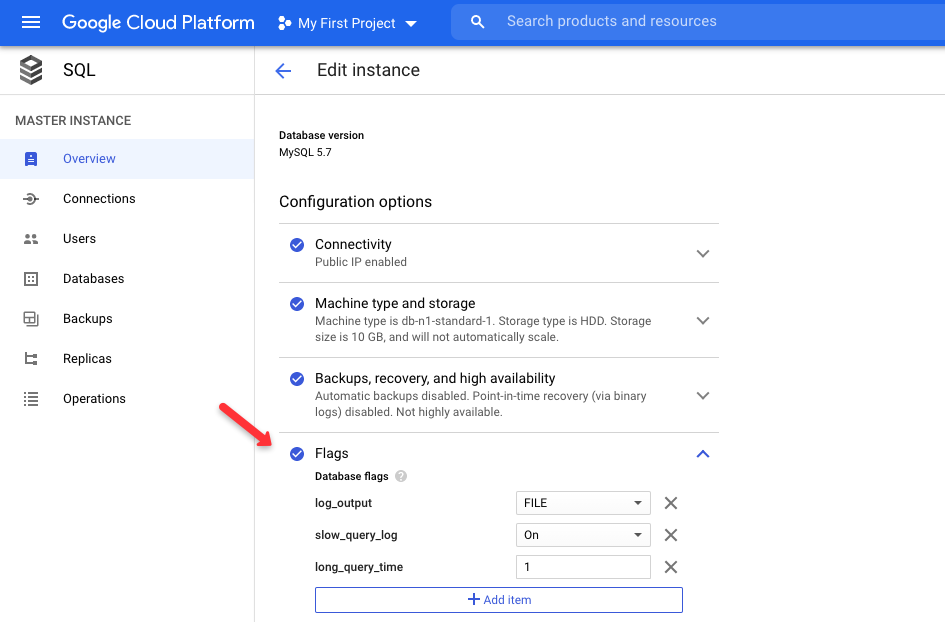
If you just added or edited these three flags, you don't need to restart your instance, as these are dynamic configuration parameters:

- log_output - file / table / none
- For Cloud SQL PostgreSQL, please add this flag to your instance:
log_min_duration_statement = 1000
View slow query logs on Google Cloud SQL
- Open Google Cloud Logs viewer
- Under the Logs field explorer, you will see your slow log file
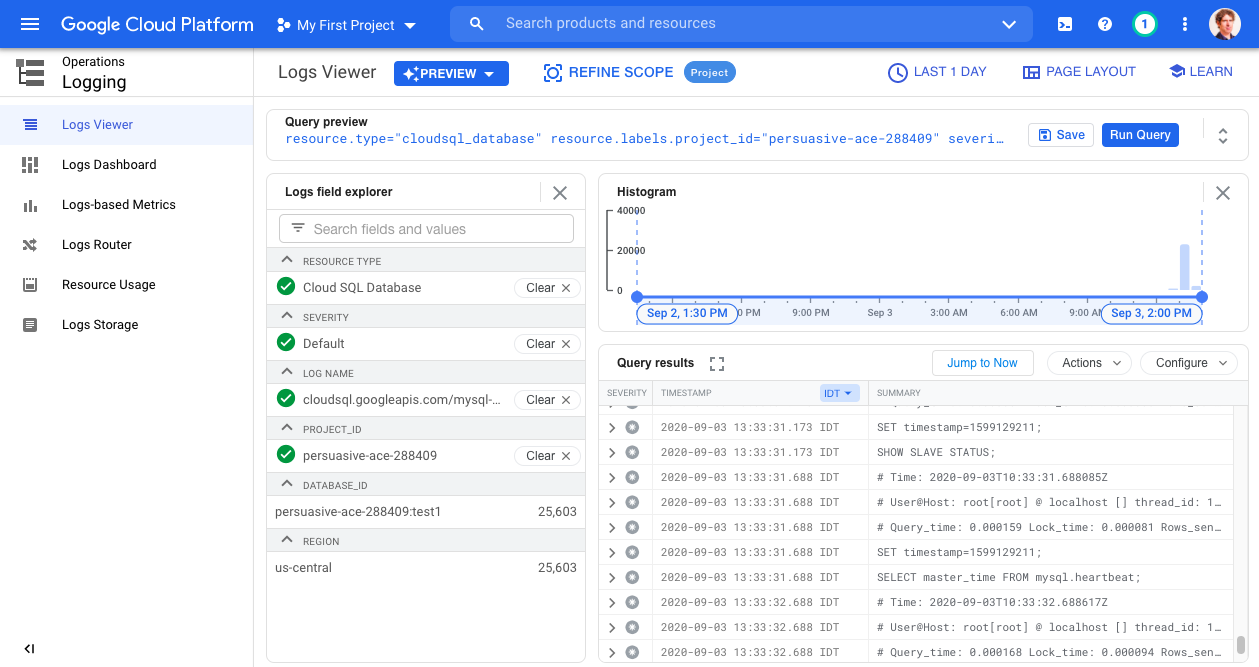
Google Cloud logs viewer - New Interface 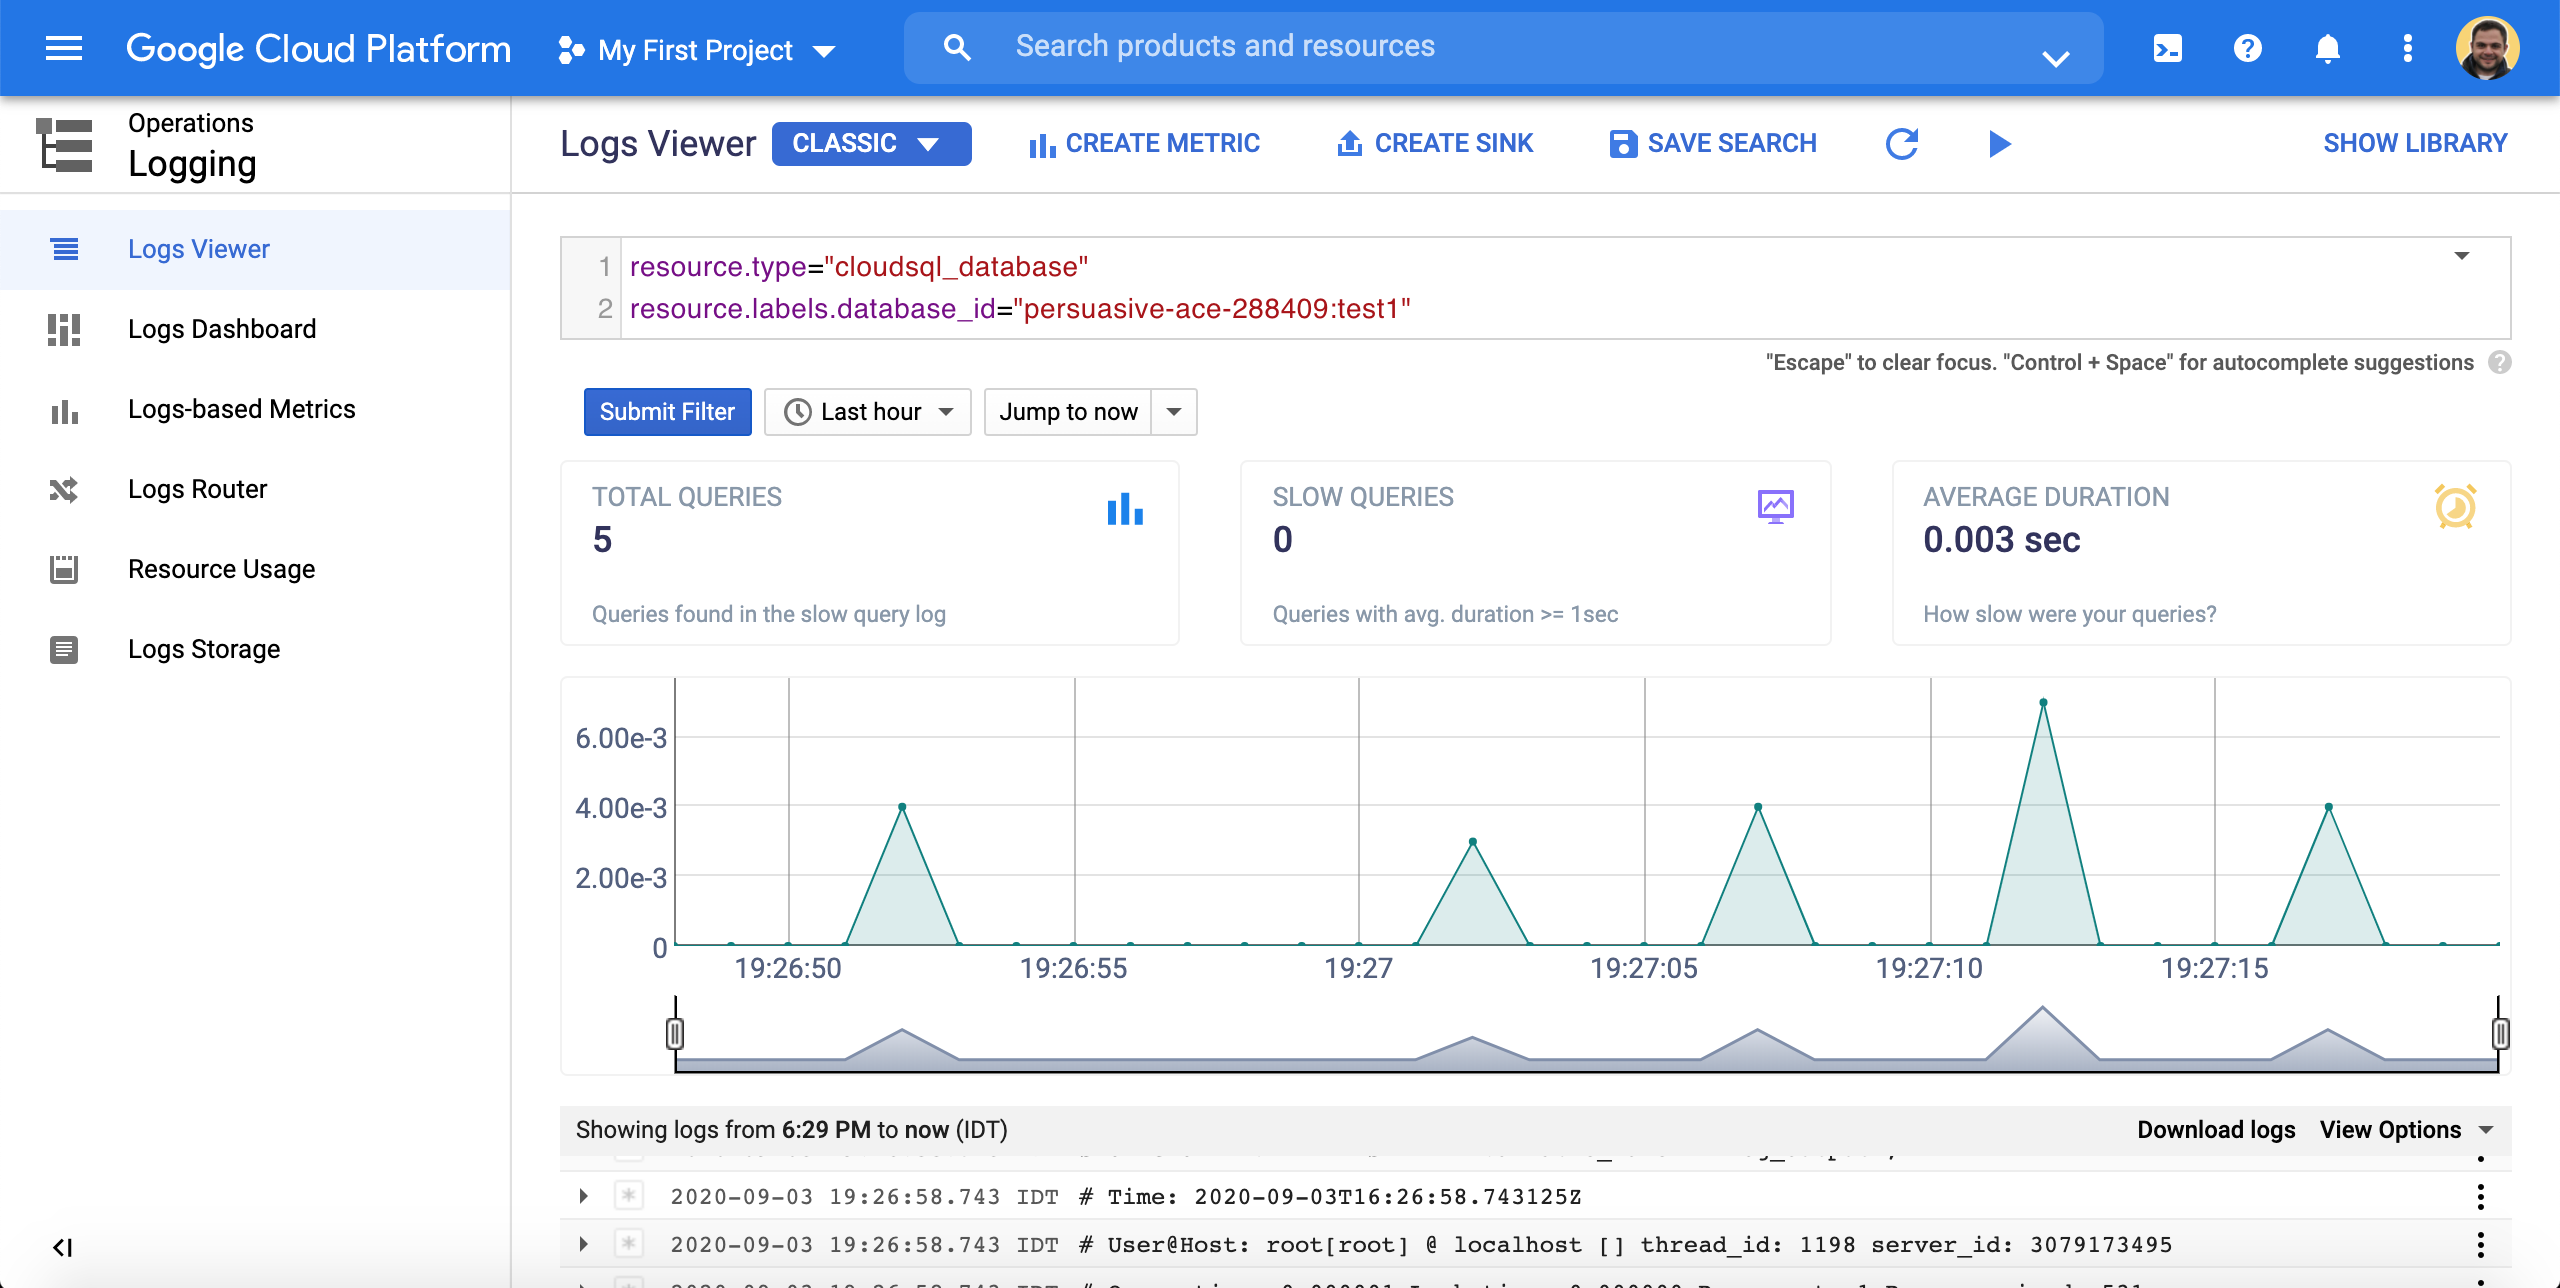
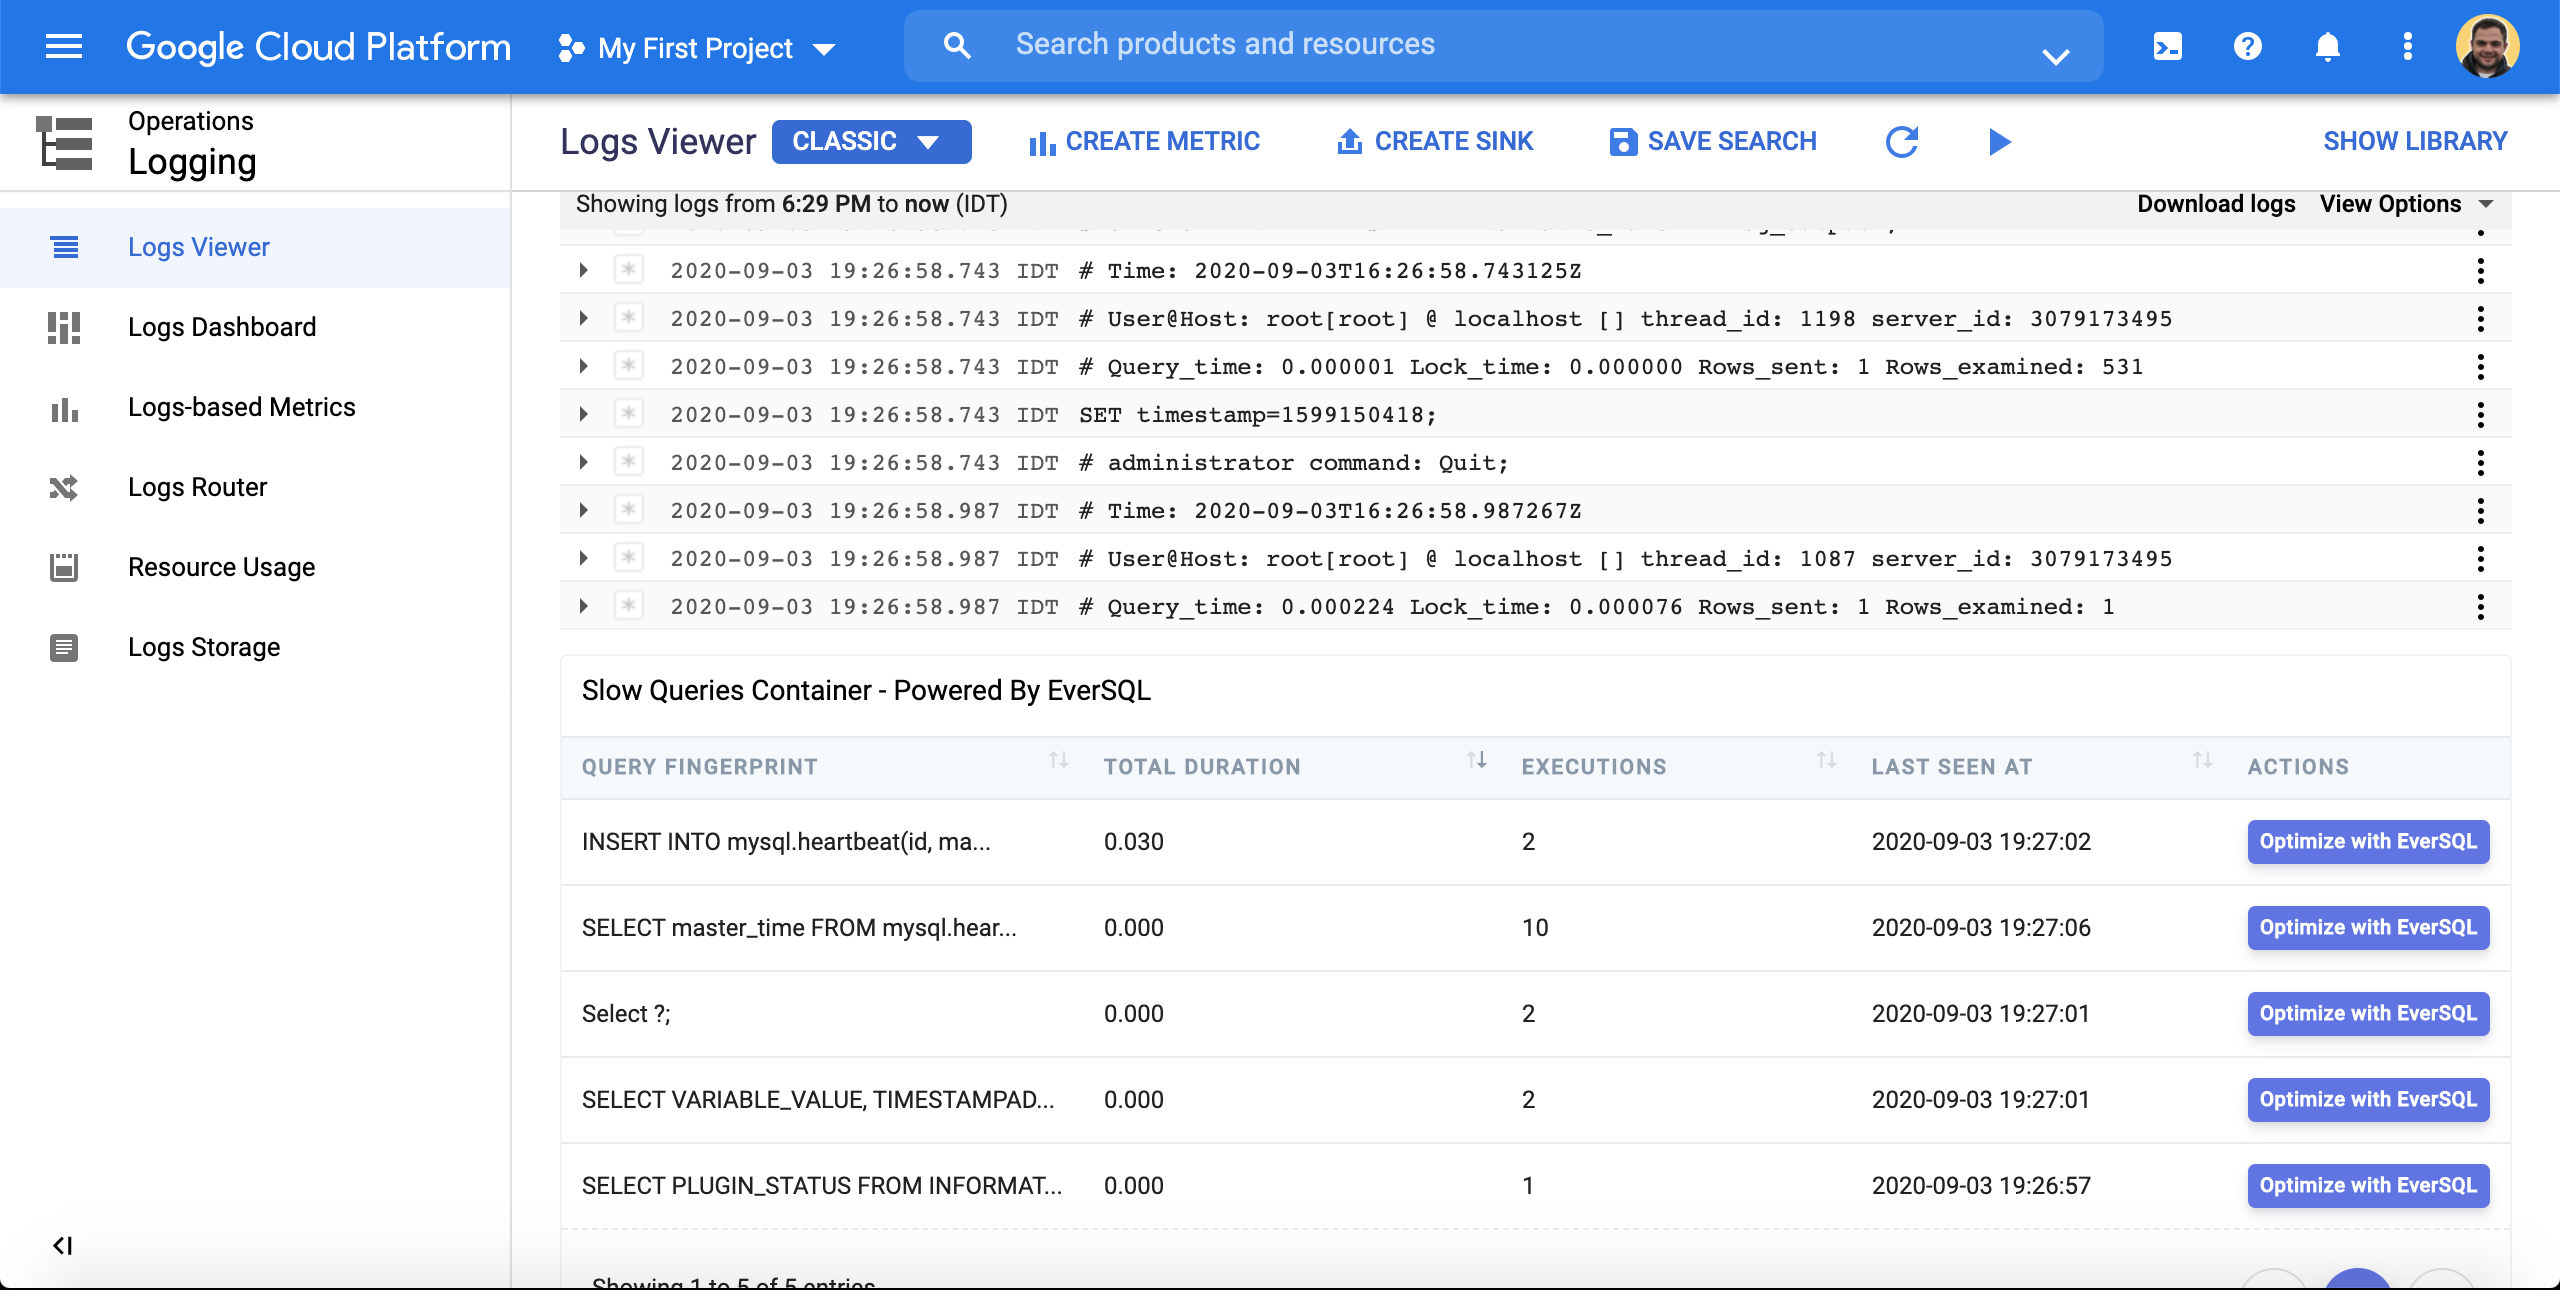
Google Cloud logs viewer - Classic Interface
Visualize and optimize slow queries from Google Cloud SQL
The next and final step will be to install EverSQL's Chrome extension - no configuration needed. Once you're done, you can navigate to the Logging tab in the Google Cloud logs dashboard, and start scrolling through the logs, or navigating to a specific point in time where you suspect a performance-related incident occurred.
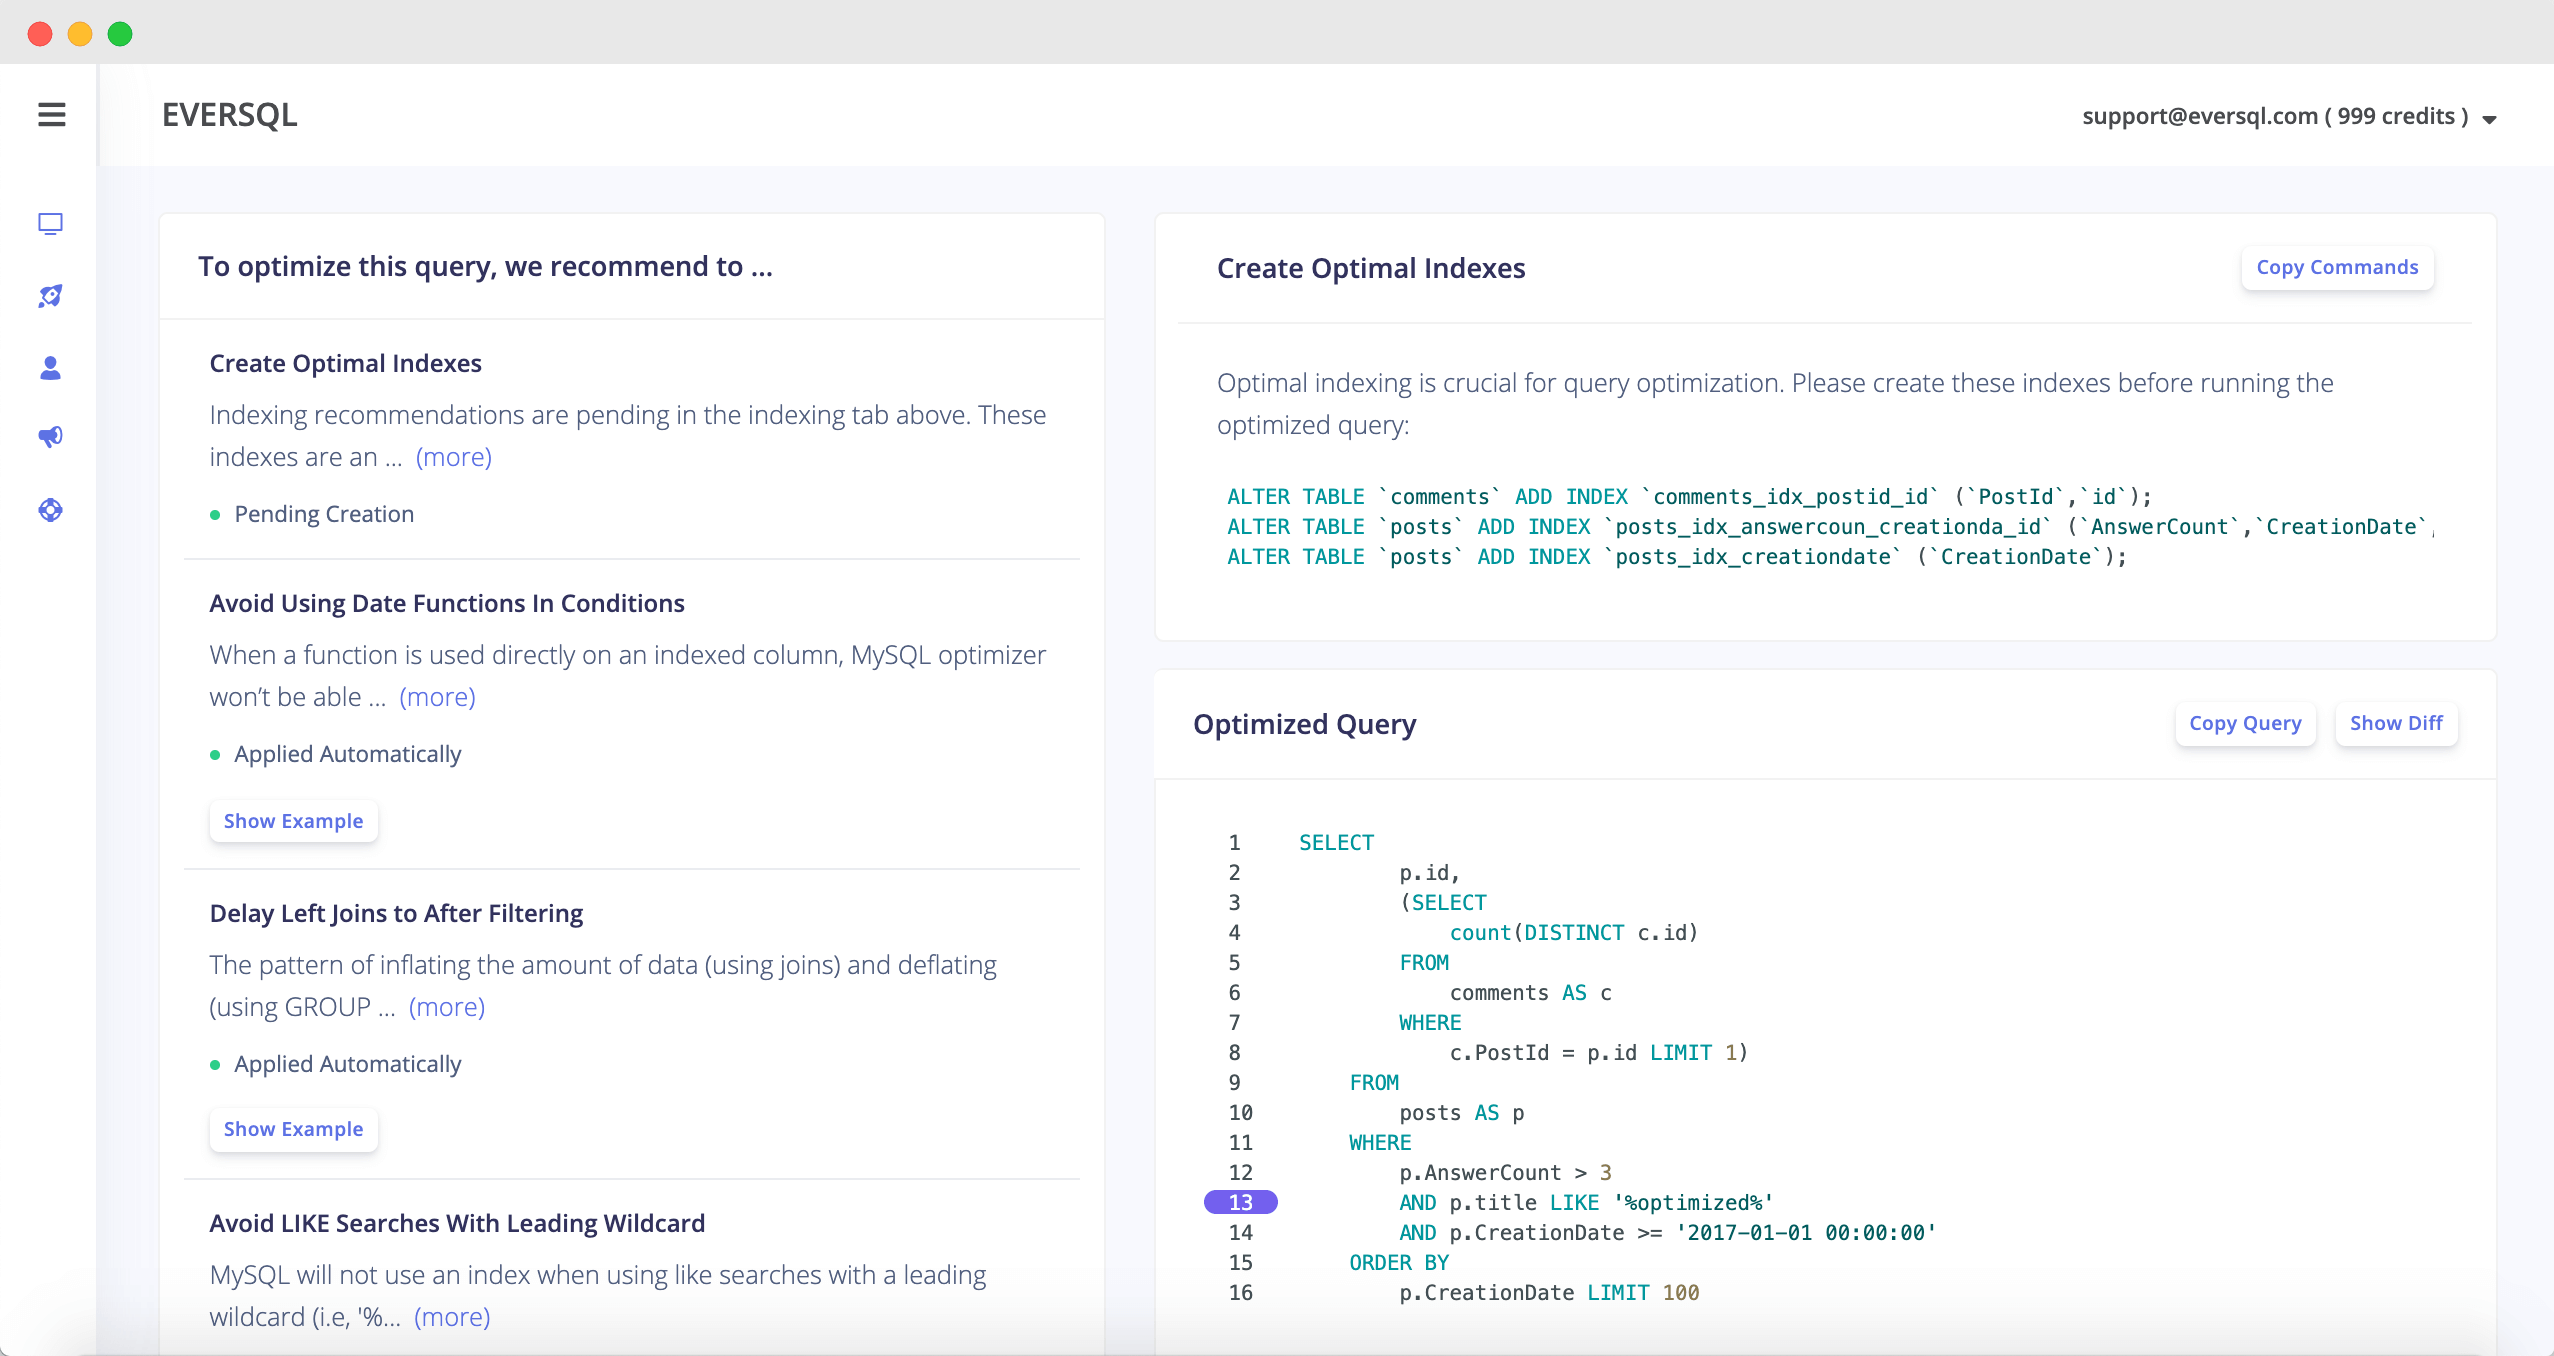
Once you found the queries you'd like to optimize, just click the Optimize with EverSQL button next to the query, and you'll be prompted with the query optimization recommendations and the optimal indexing suggestions, as in this example:
