This post's content
We all love PostgreSQL, but sometimes, usually around 3 AM, it can reach a 100% CPU usage, which can be annoying for us, and a disaster for our customers. So how can you find the root cause and fix it?
1. Locate the root cause
There might be many reasons for the 100% CPU Usage. If you are using CloudWatch, EverSQL or any PostgreSQL monitoring solution, you can start your investigation there.
To understand what happened in your PostgreSQL, you should enable your database's slow query log feature. This will capture all the slow log queries into a log, based on a threshold that you define.
If you need, we created a step-by-step guide on how to enable the slow query log.
Enabling slowlog has a very low impact on your database, so if your threshold is higher than 2 seconds or higher, you should probably not worry about it affecting your performance.
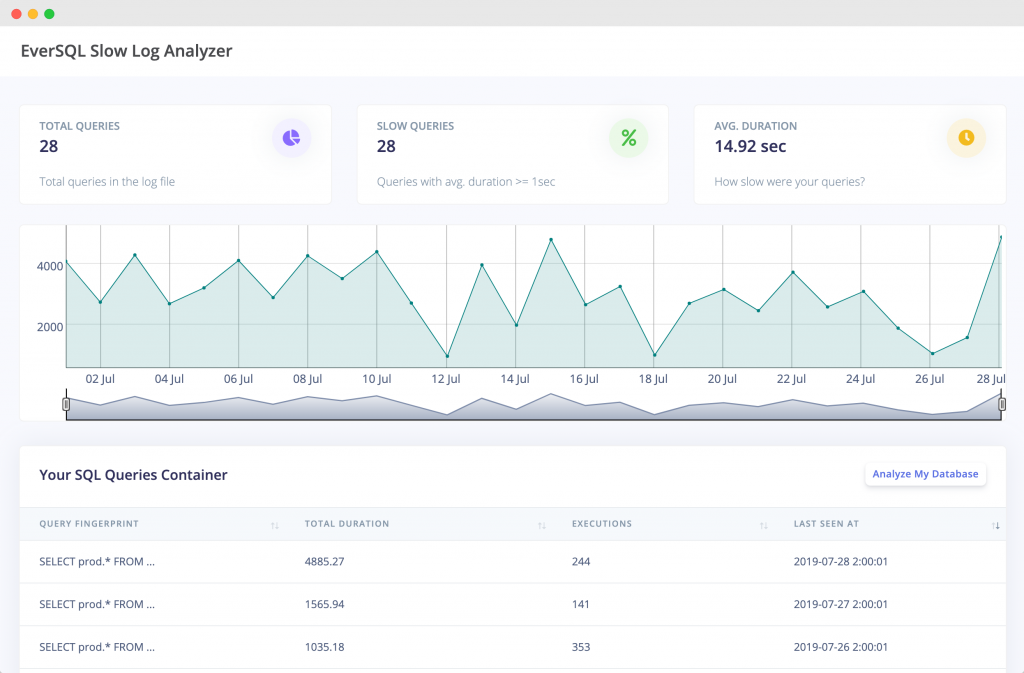
Once you enabled it, you can use slowquerylog.com to visualize the logs on a timeline and zoom-in on the specific issue.
Now, after you have some logs, you can start the investigation:
-
- When did it start?
- Did you have a major traffic increase?
- Did you release a new feature / major release?
- Did you change anything? (database configuration parameters? Did you enable persistent connection? Upgrade? Moved to a new infra?)

2. Fix the performance issue

There can be many reasons for the sudden increase in CPU usage. Here are a few tips on how to fix it:
- Check out which PostgreSQL users are logged in. Maybe there is a specific new user that's hammering the system. You can do that using the following query:
SELECT
  pid
  ,datname
  ,usename
  ,application_name
  ,client_hostname
  ,client_port
  ,backend_start
  ,query_start
  ,query
  ,state
FROM pg_stat_activity
WHERE state = 'active';
Note: You should have admin privileges to see all users. Otherwise, you will only see your own processes.
Note: You may use 'idle' instead of active to get already executed connections/queries.In general PostgreSQL has great internal tables with valuable information: pg_stat_statements and pg_stat_activity.
- Check your shared Buffer size (aka PostgreSQL Buffer) - As PostgreSQL doesn't us direct access to the disk, your backend postgreSQL process, that executes the query, utilize memory to access the data. if the relevant data is not in the buffer/cache, the server will read the relevant information from the disk and will require a lot of memory allocation. If the shared buffer size is small, the database will need to perform a lot of cache swapping.
PostgreSQL uses its own buffer, including the kernel buffered, which means that sometimes restarting the database without restarting the server will not completely clean the cache.
When inserting or updating information, data is first written to shared_buffer, later to the kernel buffer and later to the disk.
The shared_buffers parameter is the dedicated memory allocated to PostgreSQL, to use for caching data.
How to view PostgreSQL's shared_buffers size? Just run:SHOW shared_buffers;
The output includes the measurement unit, for example: 193784kB
Usually it is recommended to have at least 25% of the memory in your Instance. If you have a big workload you can increase it to up to 40% of the instance memory, as PostgreSQL officially mentions that above 40% is likely not improve the performance. Please note that if you change the shared_buffers value, you should also increase the max_wal_size (write ahead log), to help the writing processes to utilize the bigger cache.
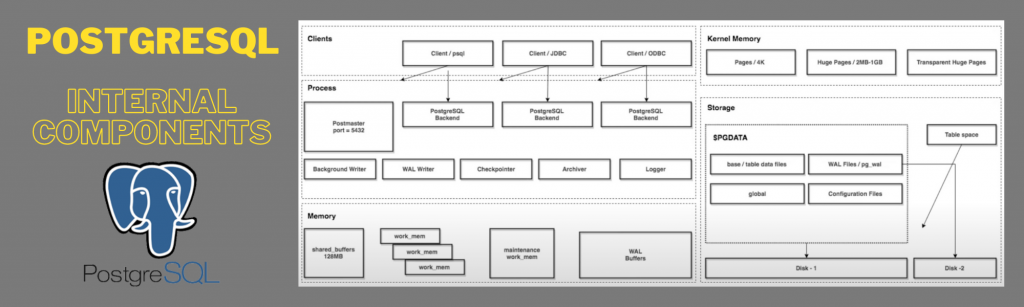
For more details about PostgreSQL's different memory components you can review the below digram:
- Check out your slow queries. You might have a new query or an old query that's suddenly running slow. You can use free tools that will help you find the top slow queries, like EverSQL.
 With such automatic PostgreSQL optimization solutions will free you to focus on what matters the most, which is your business, rather than investing your time on manually optimizing your queries and database.
 - Review database configuration parameters, like work_mem, effective_cache_size and others. You can do that by running:
SHOW ALL;
- Run a full database analysis, use AI-Based tools to fully analyze your database status and get a report on what's eating your resources:
EVERSQL
3. Make sure it will not happen again.
You don't want to be caught off guard again at 2AM when your CPU utilization is 100%, hence you should install some type of a database monitoring solution to make sure you get alerts as soon as possible.
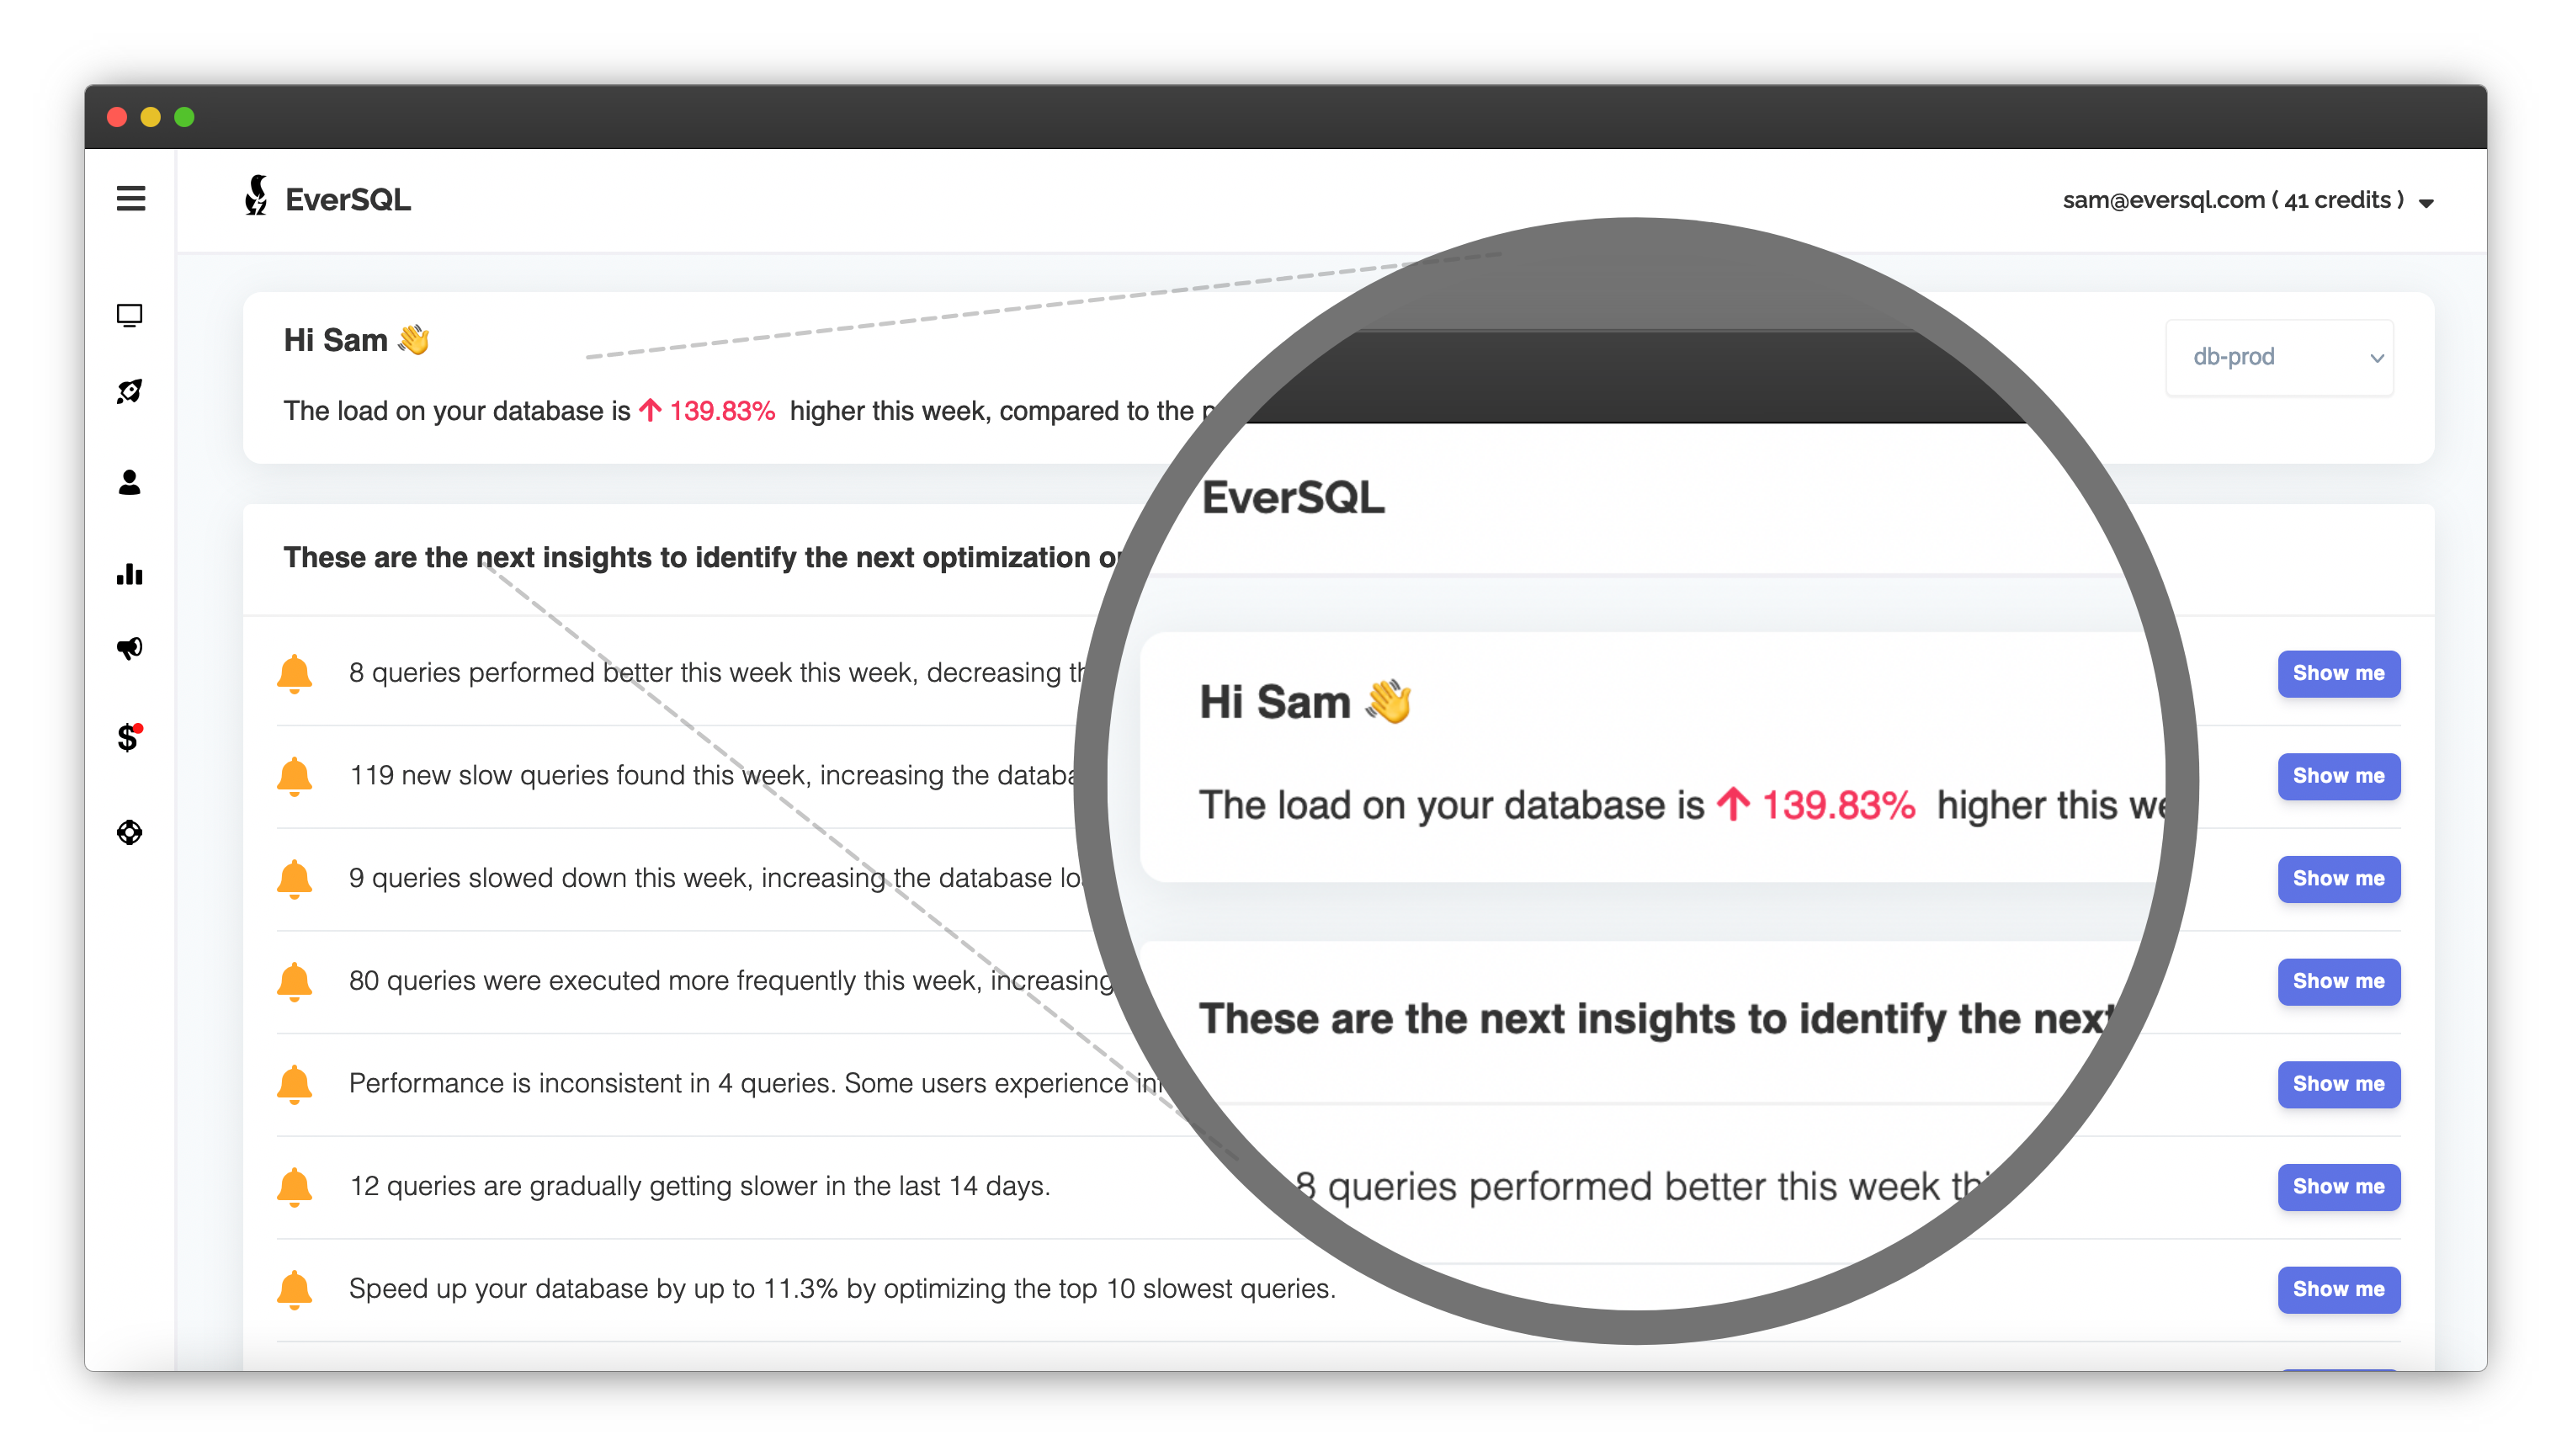
There are several Monitoring tools like NewRelic, AppDynamics and others, but for PostgreSQL you can use EverSQL Sensor, which automatically collects dozens of signals and provides you AI-powered PostgreSQL insights, such as:
- Detection of new slow queries.
- Prioritization of which queries to optimize.
- Detection of missing and redundant indexes.
- Automatic query optimization.
- and much more.
4. Summary - PostgreSQL High CPU
You can avoid production incidents generated by 100% CPU usage on your database. With tools like EverSQL you can get notifications as soon as it starts climbing, and use online solutions to fix it within a few minutes, instead of hiring expensive database consultants.
Click here to try it, for free.