This post's content
PostgreSQL is becoming one of the most popular relational databases in 2022, as you can see its Growth on DBengine records, or in the latest StackOverflow developers survey.

We have decided to review and list the top 5 PostgreSQL Monitoring tools in this article.
#1: EverSQL for PostgreSQL
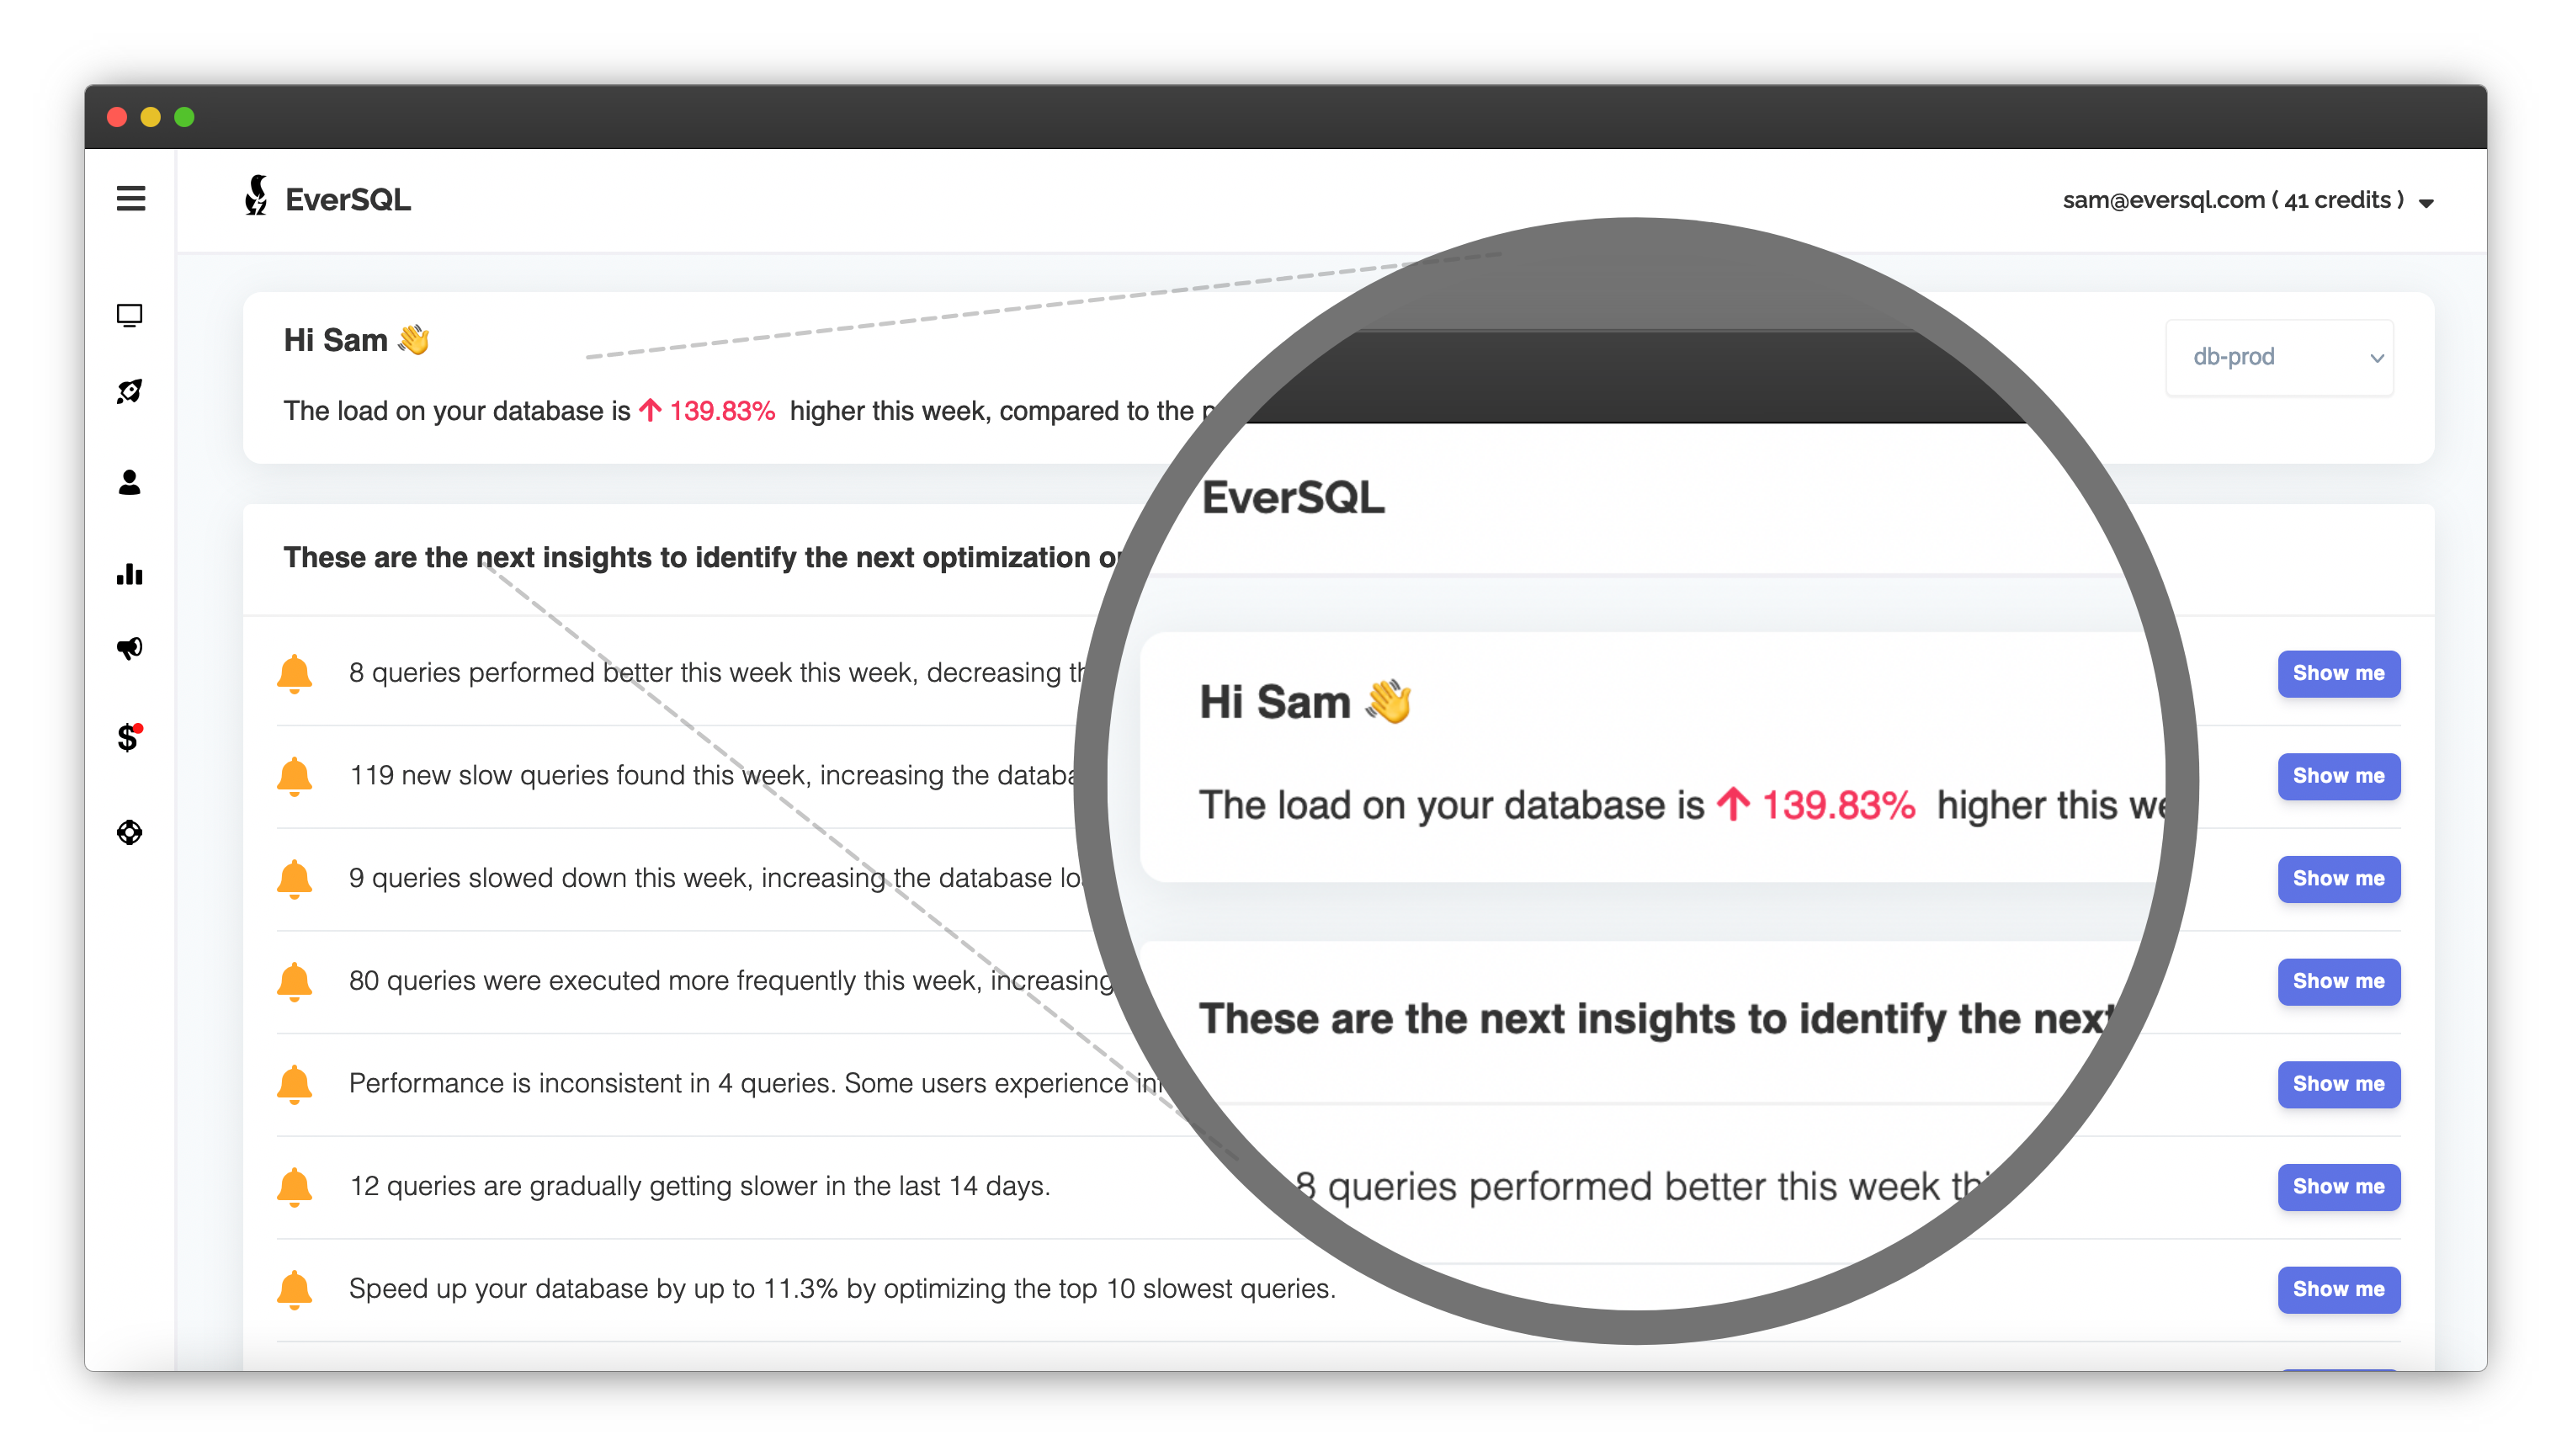
EverSQL provides a unique PostgreSQL monitoring solution, mainly focused on simplifying database monitoring and reducing the need for hiring database experts. EverSQL allows any engineer to track and automatically optimize slow SQL queries, based on trends learned from analyzing millions of real-world SQL queries.
EverSQL uses AI to analyze database activities, and provides automatic actionable insights as if a real PostgreSQL expert monitors your database 24*7.
Pros:
- No DBA skills required
- 'One-Click fix' button to solve performance bottleneck
- Automatically rewrites SQL queries and optimize them
- Recommends missing indexes automatically
- Provides insights such as workload analysis and new query load discovery
- Educate users on best practices with real examples
- Find redundant indexes
- Analyze slow query logs and optimize queries in bulks
- Aggregate query executions by fingerprints for easier prioritization
- Advanced query filtering
- Agentless option
- Provides top insights within minutes
- Support for both cloud-based and on-premise platforms
- Supports PostgreSQL on AWS EC2, AWS Aurora, Google Cloud SQL, Google Compute, Azure VB, Azure DB, Centos, Debian, Windows, Ubuntu and RedHat, Fedora and more.
Price: Free insights as a part of the free tier, and one free query optimization. 14-days free trial for advanced features.
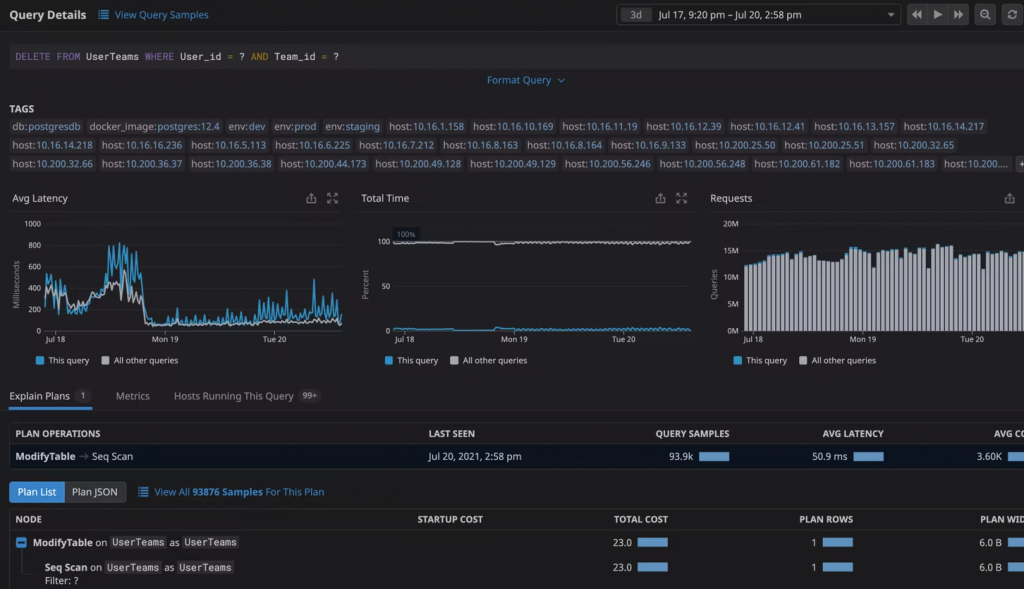
#2: DataDog
DataDog Database Monitoring allows you to view explain plans from all of your databases in a single place. With Database Monitoring, any database expert can quickly pinpoint costly and slow queries and drill into precise execution details to address bottlenecks. Additionally, query and host metric correlation makes it easy to identify and understand the impact of resource constraints on database performance.
Pros:
-
- Out-of-the-box integration with the rest of the Datadog platform, including dashboards, monitors, SLO tracking, and advanced formulas and functions
- Display differences between multiple explain plans
- Monitors connections, queries, raw access
- Monitor Host and instance
- Track Backup and Replication status
- Disk monitoring for capacity planning
- Role-based access control
- SLA monitoring
- Auto-discovers replication topology
- Full NDB cluster support (Auto-Discovery, Visualization, and grouping of NDB processes)
- User statistics report
Price: Per Server. You need to be an existing DataDog Infrastructure Monitoring customer to purchase Database Monitoring.
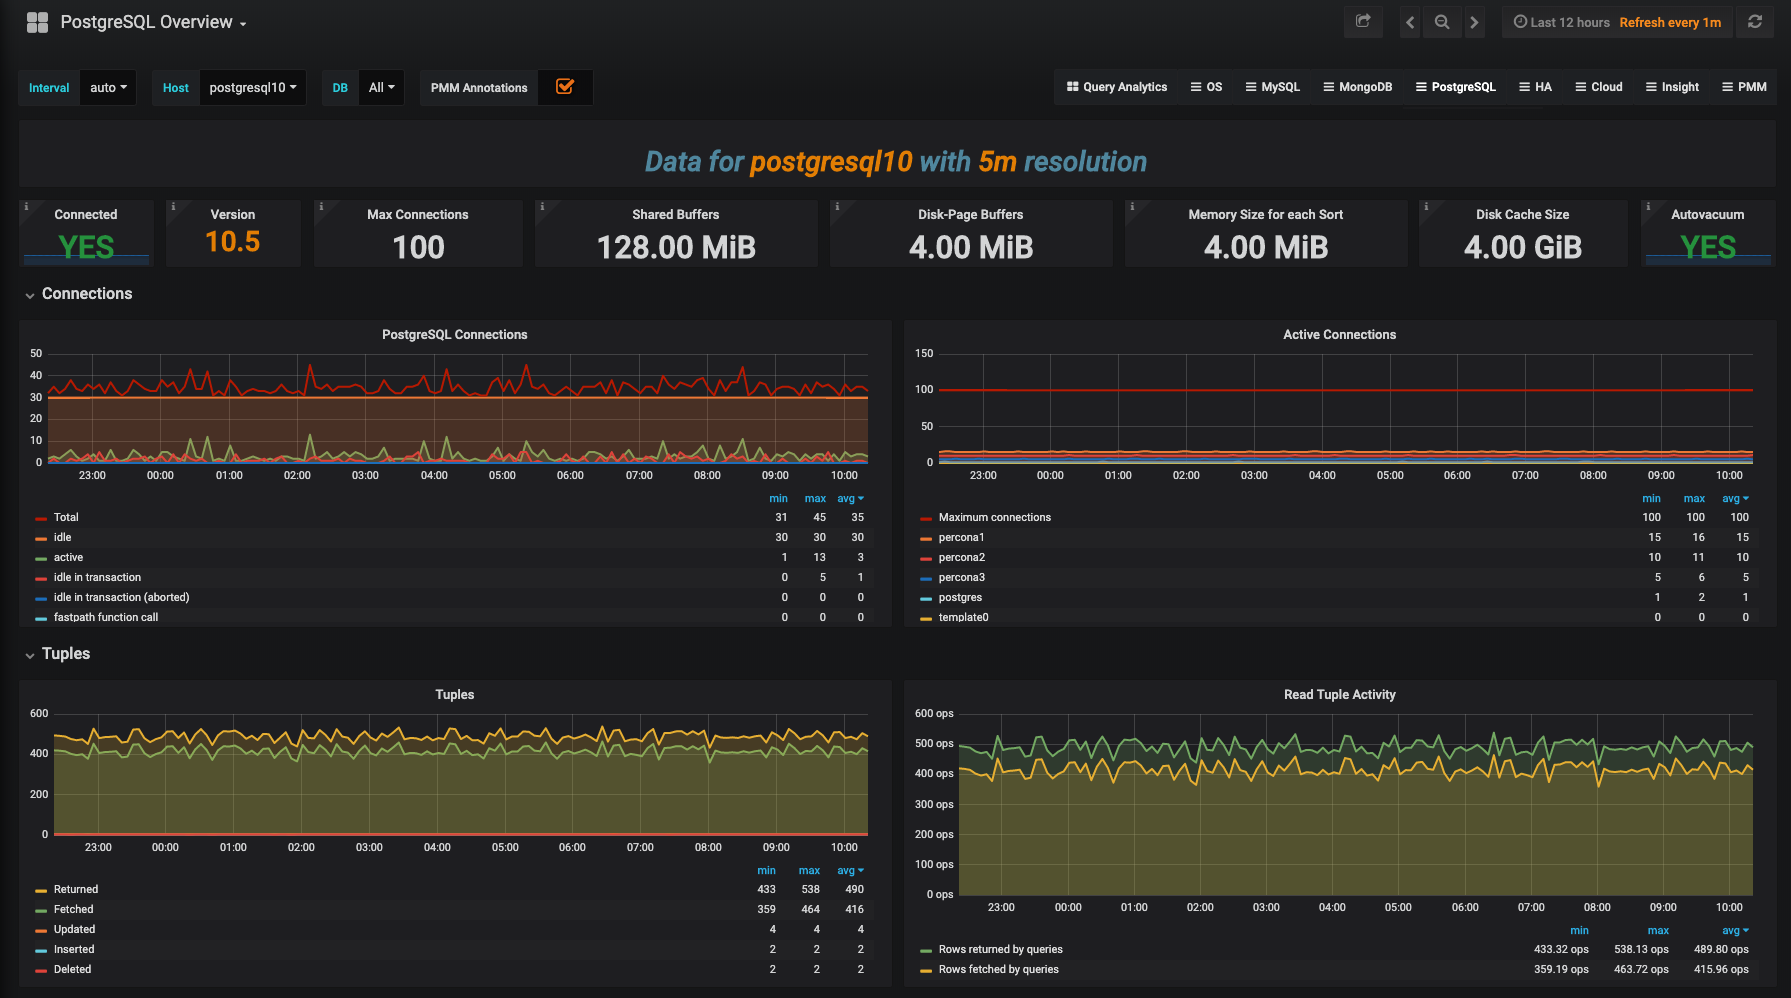
#3: Percona Monitoring and Management (PMM)
A free and open-source platform for managing and monitoring PostgreSQL performance, and provides time-based analysis to ensure that your data works as efficiently as possible.
Pros:
- Group like-systems together based on Cluster, Replication Set, Geographic Area, custom labels, and more.
- Easy set-up
- Query analytics
- Point-in-time visibility and historical trending
- Review fleets of servers and drill down to Clusters
- Integration with MongoDB query profiler
- Administrative API
- Based on Grafana and Prometheus
- Find slowest queries
Price: Free and open-source platform
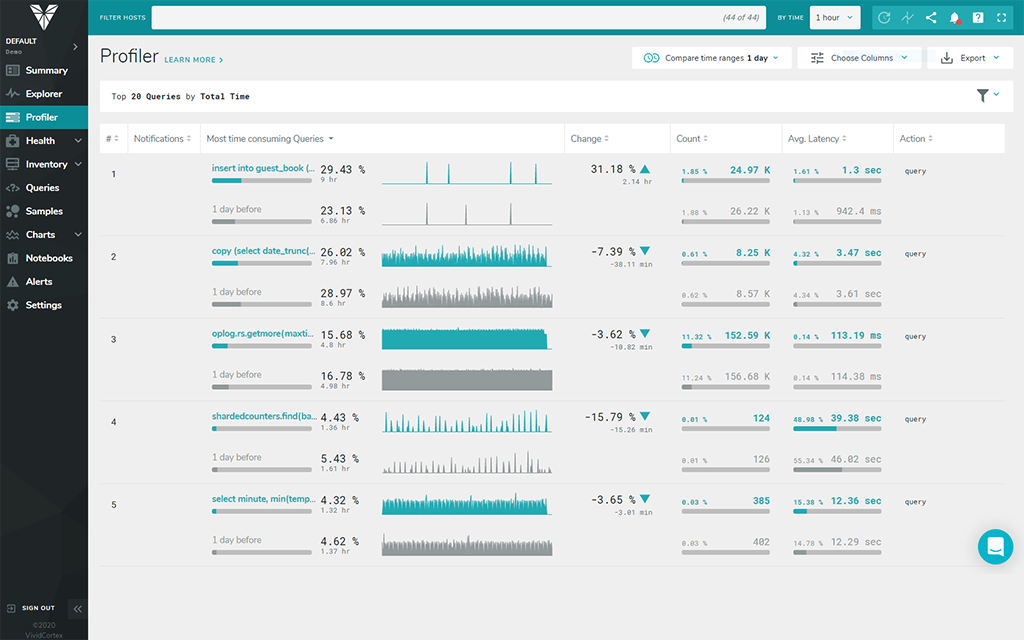
#4: VividCortex (DPM)
Database performance monitoring and optimization for open source and NoSQL databases. VividCortex is a database workload and a performance monitoring suite. VividCortex was acquired by Solarwinds who develop additional tools for IT managers.
Pros:
- SaaS based solution
- Lightweight agents with multiple configurations
- Compare performance before and after new code deployment
- Supports both Citus and PgBouncer. To monitor PgBouncer, DPM must be installed using the local, on-host configuration.
- Find slowest queries
- Monitor Database health
- Create customized dashboards
- Adaptive fault detection helps find small interruptions to server or service availability.
- Advanced Query filtering
- Disk latency monitoring
Price: 14-days free trial. Starts at $3,165
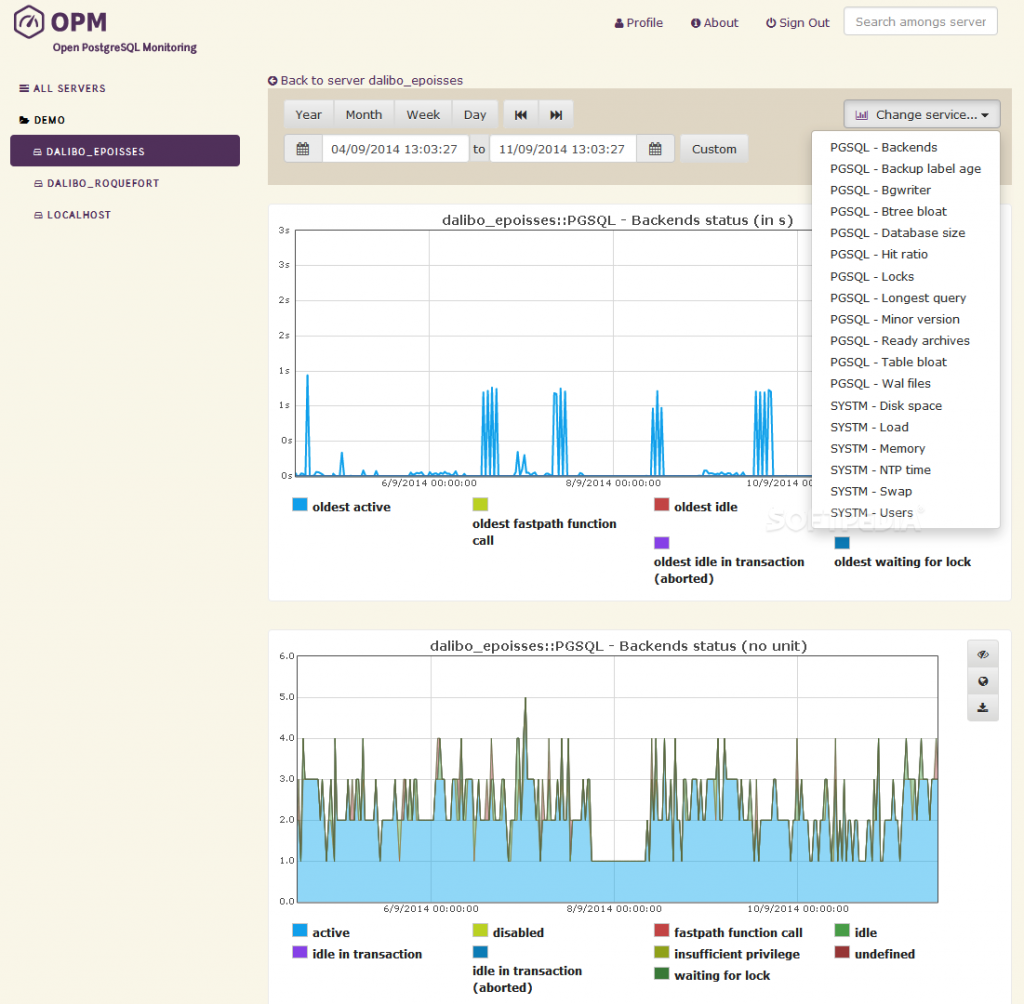
#5: OPM - Open PostgreSQL
Open PostgreSQL Monitoring, OPM is a set of tools working above Nagios (or similar) to store into a database the perfdata retrieved by any Nagios agent and graph them in a web dashboard.
Pros:
- Supports Redhat, Debian,
- Based on Nagios
- Cluster support
- Open source and can be modified.
- Monitor in real-time for corrective action and issues resolution
- Replication monitoring
- Audit logs option
Price: Open source