
TLDR: Are you a software engineer or a data analyst? Do you need to review other people's SQL queries? This SQL to Plain English free tool can be life-changing for you.
As a software engineer, I know how daunting it can be to work with complex SQL queries. Spending hours trying to understand what a query does, only to realize you still don't fully comprehend it, can be frustrating. That's why I was thrilled to discover TextToSQL, a free tool that generates a one-line English sentence describing what a complex SQL query does.
With TextToSQL, I could easily analyze SQL queries and understand their purpose. For example, if you have an e-commerce site with a 200-line complex SQL query, TextToSQL can summarize all the products sold in the last 7 days and show a prediction if a 10% price raise will affect the number of products sold.
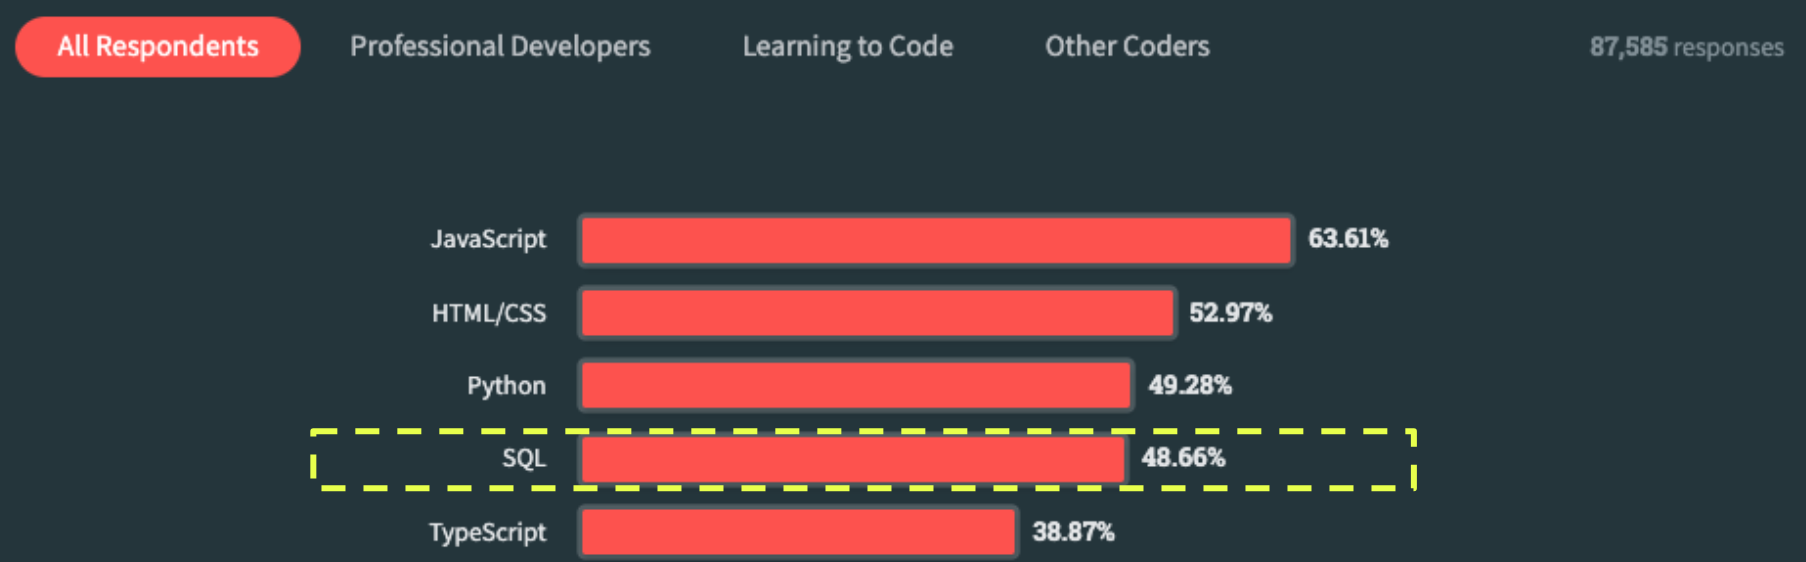
I'm not alone in my appreciation for TextToSQL. SQL is one of the most commonly used tech languages, and many data analysts and software engineers struggle with understanding complex queries. According to a survey by Stack Overflow, SQL is the fourth most popular technology language, with over 48% of respondents using it regularly.
Let me share a few examples of how it helped me. Here is a query I got via email:
SELECT product_name,
 AVG(price) AS avg_price,
 COUNT(*) AS num_orders
FROM products
JOIN order_items
ON products.product_id = order_items.product_id
JOIN orders ON order_items.order_id = orders.order_id
WHERE orders.order_date BETWEEN
'2021-01-01' AND '2021-03-31'
GROUP BY product_name
HAVING COUNT(*) >= 10
ORDER BY avg_price DESC;
It took me a few seconds to understand what it does, but using Text2SQL, we can summarize this query as follows:
"Retrieve the names of products that were sold in at least 10 orders between January 1, 2021, and March 31, 2021, along with their average price. Sort the results by average price in descending order."
Let's take another example, can you understand what the following query does?
SELECT p.product_name,
COUNT(o.order_id) AS total_orders,
SUM(oi.quantity) AS total_quantity,
SUM(oi.price * oi.quantity) AS total_revenue
FROM products p
JOIN order_items oi
ON p.product_id = oi.product_id
JOIN orders o ON o.order_id = oi.order_id
GROUP BY p.product_name
ORDER BY total_revenue DESC;
Well, you can try and review it, but using automatic text to SQL tools you can easily understand that This query calculates and ranks the total revenue, quantity, and number of orders for each product in an e-commerce store.
Simple right? Let’s see another one:
SELECT customer_name,
(customer_email ~* '^[A-Za-z0-9._%+-]+@[A-Za-z0-9.-]+
\.[A-Za-z]{2,}$') AS is_valid_email
FROM customers
WHERE customer_phone ~* '^\+[0-9]{1,3}-
[0-9]{3}-[0-9]{3}-[0-9]{4}$';
Give it one more second, do you understand what it does? with SQLtoText you can see that this query retrieves the customer names and checks if their email addresses are valid, while also filtering for customers whose phone numbers are in the format of "+[country code]-[3-digit area code]-[3-digit prefix]-[4-digit line number].
Here is one more example:
SELECT CONCAT(LEFT(first_name, 1),
'.', LEFT(last_name, 1)) AS initials,
DATE_PART('year', CURRENT_DATE) -
DATE_PART('year', date_of_birth) AS age,
COUNT(*) FILTER
(WHERE total_amount > 100) AS high_value_orders
FROM customers
GROUP BY initials, age
HAVING age > 30
ORDER BY high_value_orders DESC;
Can you guess what the above query does?
This query retrieves the initials of customers' names, calculates their age, and counts the number of high-value orders. It groups the results by initials and age, filters for customers above the age of 30, and orders the results based on the count of high-value orders in descending order.
Here's another example of a complex SQL query related to sales and forecasting, along with its summary using TextToSQL:
WITH sales_data AS
 ( SELECT product_id,
   DATE_TRUNC('week', order_date) AS week_start,
   SUM(quantity_ordered) AS total_sales
   FROM order_items JOIN orders
   ON order_items.order_id = orders.order_id
   WHERE orders.order_date
   BETWEEN '2021-01-01' AND
   '2021-06-30' GROUP BY product_id,
   week_start),weekly_averages
   AS
   ( SELECT product_id,
     AVG(total_sales)
     AS weekly_avg
     FROM sales_data
     GROUP BY product_id),
   forecast_data AS
   ( SELECT product_id,
     DATE_TRUNC('week', CURRENT_DATE)
     + INTERVAL '1 week' *
     generate_series(1, 12) AS
     forecast_week FROM sales_data
     GROUP BY product_id,
     forecast_week),
   forecasted_sales AS
   ( SELECT forecast_data.product_id,
     forecast_data.forecast_week,
     weekly_averages.weekly_avg
     FROM forecast_data
     JOIN weekly_averages
     ON forecast_data.product_id
      = weekly_averages.product_id)
   SELECT products.product_name,
   forecasted_sales.forecast_week,
   forecasted_sales.weekly_avg * 1.1
   AS forecasted_sales
   FROM forecasted_sales
   JOIN products
   ON forecasted_sales.product_id
      = products.product_id
   WHERE forecasted_sales.forecast_week
   BETWEEN '2021-07-01' AND
   '2021-12-31'
   ORDER BY products.product_name,
   forecasted_sales.forecast_week;
Using TextToSQL, we can summarize this query as follows: Calculate a 12-week sales forecast for each product based on historical sales data from January 1, 2021, to June 30, 2021. Retrieve the product name, forecasted week, and forecasted sales for the period between July 1, 2021, and December 31, 2021, sorted by product name and forecasted week.
It also helped me to compare two very similar queries that were completely different:
Query 1:
SELECT product_name,
SUM(quantity_ordered)
  AS total_sales
FROM products
JOIN order_items
 ON products.product_id =
 order_items.product_id
JOIN orders ON
 order_items.order_id =
 orders.order_id
WHERE orders.order_date
 BETWEEN '2021-01-01' AND
 '2021-06-30'
GROUP BY product_name
HAVING SUM(quantity_ordered)
 >= 100
ORDER BY total_sales DESC
vs
Query 2:
SELECT product_name,
 SUM(order_items.quantity_ordered
 * order_items.unit_price)
  AS total_revenue
FROM products
JOIN order_items
ON products.product_id =
order_items.product_id
JOIN orders
ON order_items.order_id =
 orders.order_id
WHERE orders.order_date
BETWEEN '2021-01-01' AND
 '2021-06-30'
GROUP BY product_name
HAVING SUM(order_items.quantity_ordered
 * order_items.unit_price)
>= 500
ORDER BY total_revenue DESC
Both queries start with SELECT product_name, and involve joins, group by clauses, and having clauses. However, they are performing completely different tasks.
Query 1 is retrieving the names of products that have sold at least 100 units between January 1, 2021, and June 30, 2021, sorted by total sales in descending order.
Query 2 is retrieving the names of products that have generated at least $500 in revenue between January 1, 2021, and June 30, 2021, sorted by total revenue in descending order.
Summary
As you can see, this online SQL to Text tool saved me a lot of hours, can handle SQL queries of varying complexity and provide a clear and concise summary of what they do.