
PostgreSQL allows logging slow queries to a file, with a configured query duration threshold. Parsing the slow log with tools such as EverSQL Query Optimizer will allow you to quickly locate the most common and slowest SQL queries in the database. You can optimize these queries automatically using EverSQL Query Optimizer.
Enabling PostgreSQL Slow Query Log on AWS RDS
To enable slow query logging on AWS RDS PostgreSQL, modify a customized parameter group associated with the database instance:
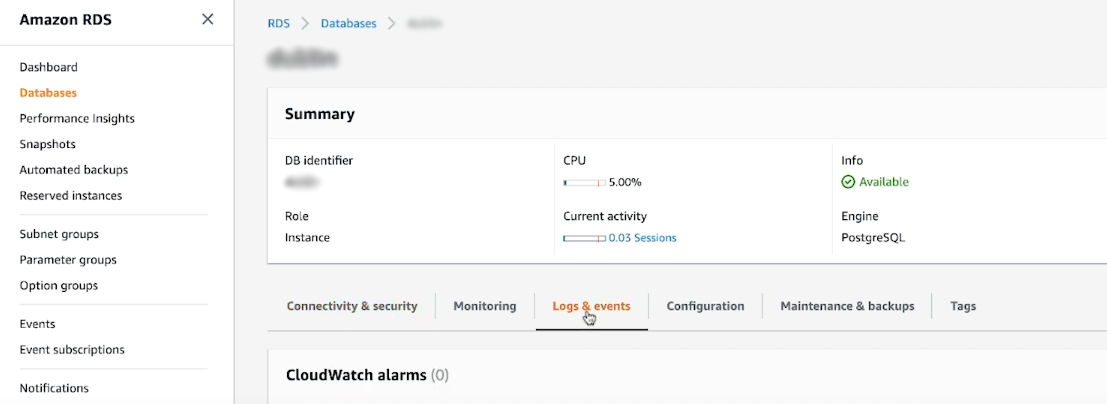
- Open the AWS RDS console, and choose Databases.
- Choose the relevant database instance.
- Select the Configuration view to see the details of the database instance and check which parameter group is associated with the database.
Note: When you create a new RDS database, the instance is associated with the default DB parameter group. You cannot modify the default DB parameter group; Please create a custom parameter group. When you update the DB instance parameter group, from default to a custom group, you must reboot the database instance. - Select the parameter group that you want to modify.
- Edit the value of the following parameter:
- log_min_duration_statement = 1000 (1,000 means one second, as this value is in milliseconds)
Note: Setting this to zero prints all statement durations. Minus-one (the default) disables logging statement durations. For example, if you set it to 250ms then all SQL statements that run 250ms or longer will be logged.
- log_min_duration_statement = 1000 (1,000 means one second, as this value is in milliseconds)
- Don't forget to Save changes.
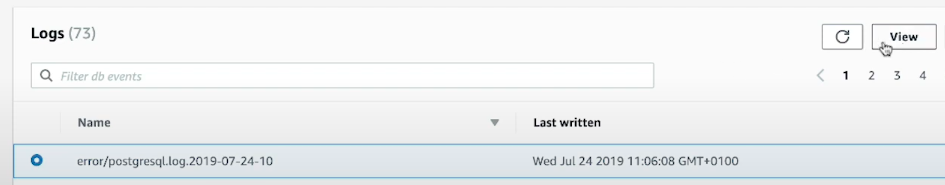
Note: If your database already has a custom parameter group, you don't need to reboot the instance for these parameters to take effect. as these parameters are dynamic - Verify that it works - run a few select queries and go back to the console, select Databases, choose your instance, and choose the logs & events view. In the Logs tab, select the latest log, and then click on 'View' to see the logs' content.
- Visualize your slow query log using slowquerylog.com
Enabling PostgreSQL Slow Query Log on other environments
- Open the postgresql.conf file in your favorite text editor.
To find the file's path, run the command: psql -U postgres -c 'SHOW config_file' - Search for the line: #log_min_duration_statement = -1
- Un-comment it and replace it with: log_min_duration_statement = 1000
* This setting will log all queries executing more than 1 second. you can change the value 1000 to the amount of milliseconds you want to set the threshold.
Note: The log_min_duration_statement parameter does not depend on or interfere with the log_statement parameter. - Save the file and refresh the PostgreSQL configuration: service postgresql reload
- The log file will now be written to one of the following paths:
- /var/lib/pgsql/PG_VERSION/data/log/
- /var/log/postgresql/
- /var/lib/postgresql/PG_VERSION/main/pg_log
- Visualize your slow query log using slowquerylog.com
General
Please ensure that you do configure the above parameters correctly, and with the right values. For example, setting log_min_duration_statement to '0' or a tiny number, and setting log_statement to 'all' can generate too much logging information, increasing your storage consumption.